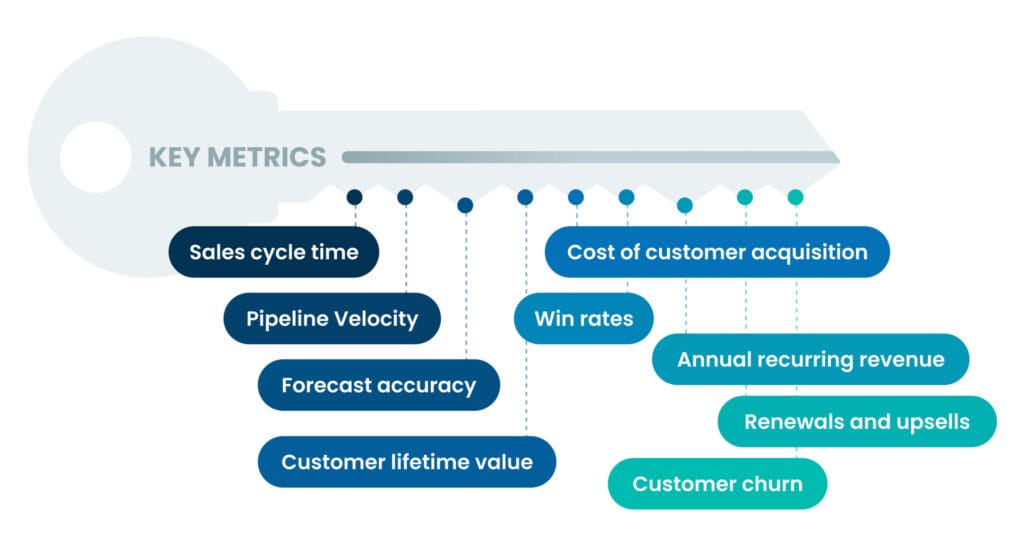
Revenue Operations KPIs are essential metrics that measure the efficiency and effectiveness of a company’s revenue-generating activities. These KPIs help businesses track performance across sales, marketing, and customer success, ensuring all departments are aligned with growth objectives and driving profitability. Understanding and optimising these KPIs is crucial for sustaining long-term success.
What are Revenue Operations KPIs?
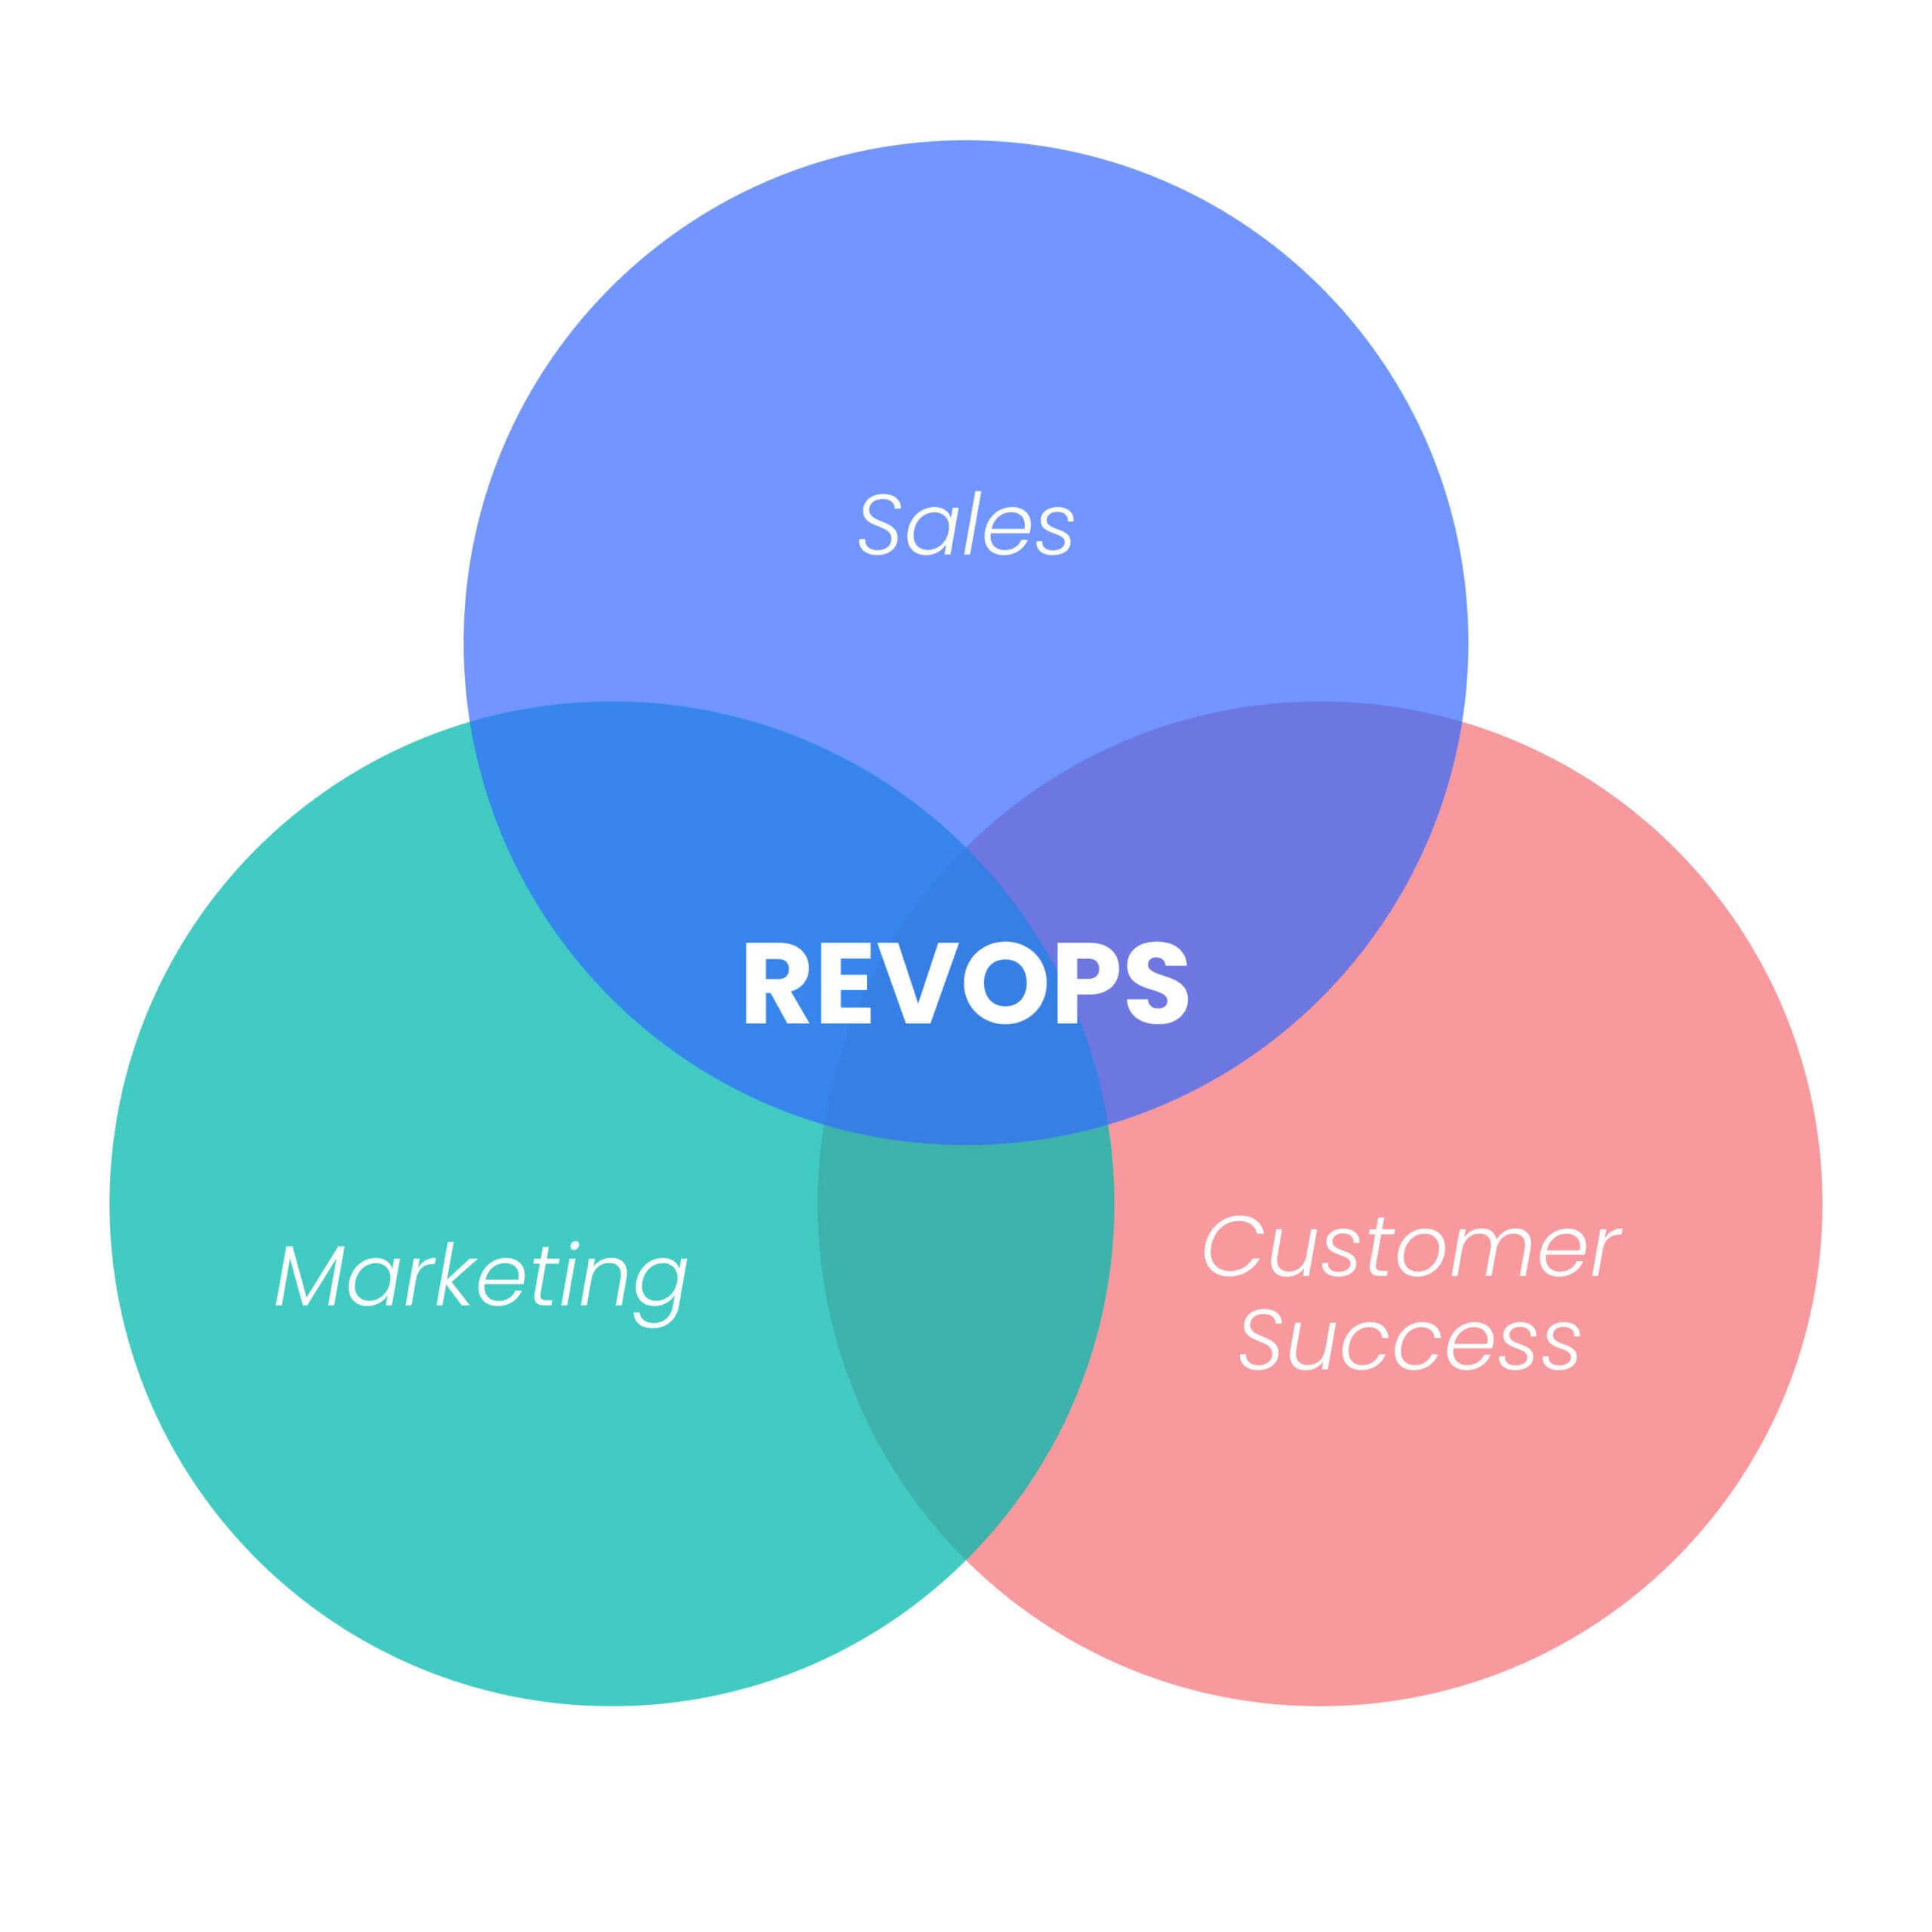
Revenue Operations KPIs (Key Performance Indicators) are essential metrics that help businesses track and optimise their revenue-generating processes. These RevOps KPIs align sales, marketing, and customer success teams to ensure operational efficiency, driving growth and profitability across departments.
Importance of Tracking Revenue Operations KPIs
Tracking Revenue Operations metrics is vital for enhancing operational efficiency, ensuring that all departments align towards shared goals. Monitoring these metrics allows businesses to identify bottlenecks, optimise processes, and make data-driven decisions that support growth.
By understanding how KPIs can boost profitability through ROI-driven ABM strategies, businesses gain actionable insights that lead to sustainable revenue growth.
How to Measure RevOps KPIs Effectively
Tools and Technologies: Leverage marketing automation tools like HubSpot, Salesforce, and Marketo to track and analyse RevOps metrics efficiently.
Regular Monitoring and Optimisation: Continuously monitor KPIs to ensure they remain relevant and adjust strategies as necessary.
Integration into Business Strategy: Align KPIs with broader business objectives to maximise their impact on overall growth and profitability. In B2B marketing, a strategic focus on ABM is a critical factor in effectively incorporating RevOps KPIs, aligning all teams around shared revenue goals.
Top 10 RevOps KPIs to Track
1. Sales Velocity
Definition:
Sales Velocity is the speed at which deals move through the sales pipeline and convert into revenue. It is calculated using the formula: (Number of Opportunities * Deal Value * Win Rate) / Sales Cycle Length.
Importance:
Sales Velocity is crucial because it shows how quickly the company can generate revenue. Higher sales velocity means faster growth and better cash flow, making it a key indicator of overall sales efficiency.
Example:
If XYZ Ltd. has 100 opportunities, an average deal value of £5,000, a win rate of 40%, and an average sales cycle of 30 days, the Sales Velocity would be: Sales Velocity = (100 * £5,000 * 0.4) / 30 = £66,666.67 per day
This indicates that XYZ Ltd. generates £66,666.67 in revenue each day from its sales activities.
2. Pipeline Metrics
Definition:
Pipeline metrics track the progression of leads through the sales funnel, from initial contact to closing the deal. These metrics include the number of leads at each stage, conversion rates, and the time taken to move from one stage to the next.
Importance:
Pipeline metrics are essential for forecasting revenue, identifying bottlenecks in the sales process, and ensuring that the sales team is on track to meet targets. They provide insights into the health of the sales process and where improvements are needed.
Example:
If XYZ Ltd. has 100 leads in the pipeline and 20 of them convert into paying customers, the pipeline conversion rate would be: Conversion Rate = (20 / 100) * 100 = 20%
This conversion rate helps the company forecast how many leads are needed to meet revenue goals.
3. Win/Loss Ratio
Definition:
The Win/Loss Ratio measures the proportion of sales opportunities that result in a closed deal (win) compared to those that are lost. This metric is a direct indicator of the sales team’s effectiveness and the competitiveness of the product or service.
Importance:
A high Win/Loss Ratio suggests that the sales process is effective and that the company’s offerings are competitive. Conversely, a low ratio may indicate issues in the sales process, product-market fit, or pricing strategy that need to be addressed.
Example:
If XYZ Ltd. had 50 opportunities in a quarter and closed 20 of them, the Win/Loss Ratio would be: Win/Loss Ratio = 20/50 = 0.4 or 40%
A 40% win rate might prompt the company to review its sales strategies or product offerings to improve competitiveness.
4. Net New Growth
Definition:
Net New Growth refers to the net increase in revenue or customer base over a specific period. It considers the balance between new customers acquired and customers lost (churned) during that time.
Importance:
This metric helps companies understand their true growth by showing whether they are expanding or merely replacing lost customers. Positive net new growth indicates that the business is growing beyond just maintaining its existing customer base.
Example:
If XYZ Ltd. gained 200 new customers but lost 50 during the quarter, the net new growth would be: Net New Growth = 200 – 50 = 150 new customers
This shows that the company is successfully expanding its customer base.
5. Customer Acquisition Cost (CAC)
Definition:
Customer Acquisition Cost (CAC) represents the total cost of acquiring a new customer, including expenses related to marketing, sales, and any other associated costs.
Importance:
CAC is a critical metric for understanding the efficiency of your marketing and sales efforts. By comparing CAC with Customer Lifetime Value (CLV), businesses can assess the profitability of their customer acquisition strategies and make informed spending decisions.
Example:
Consider a SaaS company, XYZ Ltd., that spent £200,000 on marketing and sales efforts to acquire 400 new customers. The CAC would be: CAC = £200,000 / 400 = £500 per new customer
This means XYZ Ltd. spends £500 to acquire each new customer.
6. Average Contract Value (ACV)
Definition:
Average Contract Value (ACV) measures the average annual revenue generated from each customer contract. It is particularly relevant for businesses with recurring revenue models, such as SaaS companies.
Importance:
Tracking ACV helps businesses understand the value of each customer and guides decisions around pricing, sales strategies, and marketing efforts. Higher ACV can lead to increased revenue without needing to acquire more customers.
Example:
If XYZ Ltd. has 200 customers, and the total annual revenue from these customers is £1,000,000, the ACV would be: ACV = £1,000,000 / 200 = £5,000
This means that, on average, each customer contributes £5,000 annually to the company’s revenue.
7. Adoption Rates (AR)
Definition:
Adoption Rate (AR) measures the percentage of users who actively use a product or service after purchasing it. It reflects how well customers are integrating the product into their daily operations.
Importance:
High Adoption Rates indicate that customers find value in the product, which increases the likelihood of renewals and long-term engagement. Low AR may signal issues with the product’s usability or relevance, requiring further attention.
Example:
If XYZ Ltd. has 1,000 customers and 800 of them regularly use the product, the Adoption Rate would be: AR = (800 / 1,000) * 100 = 80%
An 80% adoption rate suggests that the majority of customers are finding value in the product, which is a positive indicator for renewals.
8. Annual Recurring Revenue (ARR)
Definition:
Annual Recurring Revenue (ARR) is a metric that represents the total predictable revenue a company expects to generate annually from its recurring subscriptions or contracts. This KPI is particularly important for businesses with subscription models, as it provides a clear picture of their financial stability and growth potential.
Importance:
Tracking ARR is crucial because it forms the foundation for forecasting revenue growth, assessing business health, and making strategic decisions about scaling. It helps companies understand how much revenue they can count on each year, excluding one-time sales or non-recurring revenue streams.
Example:
Consider a SaaS company, XYZ Ltd., that has 1,500 customers, each paying £300 annually for a software subscription. The ARR would be calculated as: ARR = 1,500 * £300 = £450,000
This means XYZ Ltd. can expect to generate £450,000 annually from its current customer base.
9. Customer Retention Rate (CRR)
Definition:
Customer Retention Rate (CRR) measures the percentage of customers who continue to use a company’s product or service over a specific period, usually a year. It is a key indicator of customer loyalty and the effectiveness of retention strategies.
Importance:
High CRR indicates customer satisfaction and loyalty, which are vital for long-term profitability. Retaining customers is often less expensive than acquiring new ones, making CRR a critical metric for businesses aiming to maximise lifetime customer value and reduce churn.
Example:
If XYZ Ltd. started the year with 1,000 customers and ended with 950 after accounting for churn, the CRR would be: CRR = (950 / 1,000) * 100 = 95%
A 95% retention rate indicates that the company is successfully retaining the majority of its customer base.
10. Customer Lifetime Value (CLV)
Definition:
Customer Lifetime Value (CLV) is the total revenue a business can expect from a customer throughout their relationship. It is a key indicator of customer profitability and long-term business sustainability.
Importance:
CLV is essential for understanding the true value of a customer and informing strategies around customer retention, upselling, and marketing. A higher CLV indicates that customers are more valuable to the business, justifying higher acquisition costs.
Example:
For XYZ Ltd., if an average customer generates £500 per year and remains a customer for 5 years, the CLV would be: CLV = £500 * 5 = £2,500
This means that, on average, each customer is worth £2,500 to the company over their lifetime.
Aligning KPIs with Business Goals
When aligning Revenue Operations KPIs with business goals, it’s crucial to set SMART objectives (Specific, Measurable, Achievable, Relevant, Time-bound). This ensures that KPIs directly contribute to the company’s strategic objectives and that all teams, including sales, marketing, and customer success, work cohesively towards shared targets.
Examples of Using RevOps KPIs for Business Growth:
Sales Pipeline Velocity: Enhancing pipeline velocity through personalised engagement strategies based on the customer’s funnel stage can significantly improve conversion rates and accelerate revenue growth.
Annual Recurring Revenue (ARR) + Net New Growth: Combining these metrics provides a clear view of revenue from existing customers and the additional growth needed to meet targets.
Customer Lifetime Value (CLV): Focusing on CLV helps maximise the value of customer relationships, supporting upselling and retention strategies.
Challenges in Tracking and Optimising RevOps KPIs
Data Accuracy: Ensuring accurate and up-to-date data is crucial for reliable KPIs. Inconsistent data can lead to incorrect conclusions and misguided strategies.
Balancing Short-Term and Long-Term Goals: Aligning KPIs with both immediate and long-term objectives can be challenging but is essential for sustained growth.
How do RevOps and ABM Work Together?
Account-Based Marketing (ABM) and RevOps work together to drive growth by aligning sales, marketing, and customer service teams. RevOps centralizes customer data, providing a single source of truth that ensures teams work in harmony. This setup supports effective targeting of important accounts.
RevOps enhances ABM by enabling precise customer segmentation and personalised outreach. Teams can utilise shared insights to create marketing and sales strategies that align with their audience, improving conversion rates and customer retention.
Together, ABM and RevOps create a seamless customer experience. By streamlining processes and removing team barriers, customer interactions become more coherent and personalised. This approach boosts customer satisfaction and ensures every interaction contributes to business growth. For insights on demonstrating the value of your ABM strategy, explore our guide on key account-based marketing metrics.
Conclusion
Revenue Operations KPIs are critical tools for businesses aiming to optimise their revenue processes. By carefully tracking these RevOps metrics and aligning them with business goals, companies can drive growth, improve operational efficiency, and make data-driven decisions that lead to long-term success.
FAQs
RevOps provides a centralised data source that aligns teams, allowing ABM to focus on precise customer segmentation and personalised outreach, which drives higher engagement and retention.
Tracking Revenue Operations KPIs is crucial for understanding how different business areas contribute to revenue, identifying bottlenecks, and optimising strategies to improve operational efficiency and profitability.
ARR represents the total predictable revenue a company expects annually from recurring subscriptions. It is essential for forecasting growth, assessing financial stability, and making informed strategic decisions.
Adoption Rates measure how actively customers use a product after purchase, indicating customer engagement and satisfaction. High AR suggests strong product-market fit and a higher likelihood of renewals.
Key SaaS metrics include Customer Acquisition Cost (CAC), Customer Lifetime Value (CLV), Monthly Recurring Revenue (MRR), Churn Rate, and Net Promoter Score (NPS). These metrics help track growth, customer retention, profitability, and overall business health.
A Revenue Management strategy involves setting pricing strategies, forecasting demand, managing sales channels, and tracking key financial metrics like ARR, MRR, and CAC to maximise revenue and profitability.

